Where people live in our state in can have an effect on their life expectancy, access to healthcare, and likelihood for developing certain health conditions. Age, education, income, race/ethnicity, and other factors can also determine Coloradans’ health outcomes.
The Colorado Department of Public Health and Environment (CDPHE) has been studying these health disparities, and they have created an interactive map that looks at health data relative to a specific area in the state. The map can be used to answer questions such as the effect of population density on health; what regions have the highest or lowest life expectancy; and what parts of the state have the highest levels of asthma, diabetes, drug overdose, heart disease, low birth weight, teen pregnancy, and suicide. The map uses census tracts of 4,000 people, allowing it to give a detailed picture of disparities even between neighborhoods in the same city or town. “Data available at this level can help more effectively target efforts to remove the barriers standing in the way of health and opportunity. It allows community leaders to examine factors that might be influencing differences in longevity, such as access to health care, safe and affordable housing, educational opportunities and access to affordable transportation,” says CDPHE.
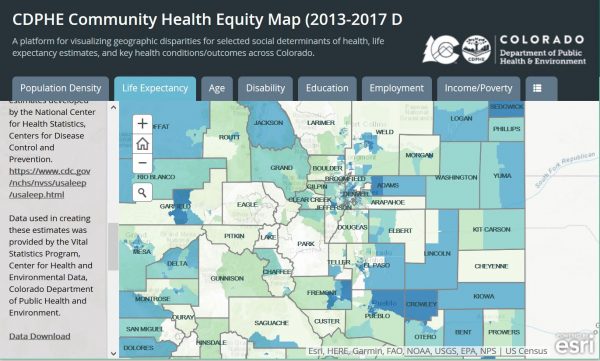
GIS data can also be downloaded from the site. Currently, the data covers 2013-2017, but will be updated as new data becomes available. For further information on CDPHE’s research into health disparities in Colorado, and how disparities have changed over time, see the following reports:
- Disparities in the Prevalence of Adult Overweight and Obesity by Demographic Characteristics (2016)
- Health Disparities Grant Program Final Evaluation Report (2015)
- Home is Where the Health Is? Exploring Healthy Housing in Colorado (2014)
- Health Disparities: Exploring Health Equity in Colorado’s 10 Winnable Battles (2013)
- Obesity and Physical Inactivity in Colorado : Demographic Characteristics and Regional Distribution (2013)
- Living Longer? Living Better? Estimates of Life Expectancy and Healthy Life Expectancy in Colorado (2012)
- The Connection Between Health Disparities and the Social Determinants of Health in Early Childhood (2010)
- Racial and Ethnic Health Disparities in Colorado (2009)
- Health Disparities as a Cornerstone of Colorado’s Health Care Reform (2008)
- Oral Health Disparities in Colorado (2006)
- Health Disparities and Cardiovascular Disease (2005)
- Profiles of Health Disparities in Diabetes Among the Hispanic/Latino Population in Colorado (2004)
- Profile of Health Disparities Among Communities of Color (2001)

- How to Spot the Differences Between Eagles and Hawks - August 16, 2021
- How Transportation Projects Help Tell the Story of Colorado’s Past - August 9, 2021
- Time Machine Tuesday: The Night the Castlewood Canyon Dam Gave Way - August 3, 2021